crashout
the pain
so something segfaults. maybe firefox, maybe a hand-rolled C thing i was poking at, maybe steam. doesn't matter. systemd dutifully writes a coredump. cool. now what.
you reach for coredumpctl list:
TIME                            PID  UID  GID SIG     COREFILE EXE                  SIZE
Sun 2026-04-19 22:11:03 -03    7741 1000 1000 SIGSEGV present  /usr/lib/firefox     142.0M
Sun 2026-04-19 22:34:51 -03    8821 1000 1000 SIGABRT present  /usr/bin/steam        58.3M
...
and now you stare at a wall of text. the columns truncate. there's no filter. no group-by-binary. no "show me only the last hour". no signal filter. the SIG column is a number sometimes and a name sometimes. you can't even see how much disk these are eating without grepping.
and to actually read a crash you do this dance:
coredumpctl info 7741   # info
coredumpctl debug 7741  # drops you into gdb. now type `bt full` and pray.
journalctl -S "10 minutes ago" -U "5 minutes ago" _PID=7741   # for context
three commands. three windows. ascii everywhere, nothing cross-linked. and if you wanted to know what your machine was doing in the 5 minutes before the crash, say a desktop notification or an OOM kill that nuked the process, you have to manually time-bracket journalctl. every single time.
i tried. i suffered. one night i had something segfaulting in a tight loop and i got to learn that scrolling through 47 coredumpctl debug sessions is what hell looks like.
what i wanted
brutal wishlist:
- one tui that lists every coredump with proper columns and a sort/filter that doesn't suck
- tab into a crash and see
info,backtrace,journal-around-the-crash,env,cmdlinewithout leaving - backtrace runs gdb in batch async so the tui doesn't freeze for 4 seconds
- a daemon that sits in the background and pops a desktop notification when anything new crashes
- a systray icon i can click to open the tui, right-click to mute notifications
- oh and while we're here, a colorized log viewer for
/var/log+ journal so i stop reaching fortail -f | grep ERROR
one binary. one terminal. no electron. no gtk. no python venv. just a fast rust thing i can cargo install and forget about until it screams at me.
arch: one binary, three modes
crashout ships as one binary with three modes:
crashout            # alias for `crashout tui` — the browser
crashout watch      # the daemon — sits, watches journal, fires notifications
crashout log <path> # one-off log viewer w/ level colorcoding
they share code (journal reads, entry parsing, level-color heuristics), but each mode is its own personality. the daemon is event-loop, lives in a systemd user service, sits there and waits. the tui is ratatui + crossterm and goes wherever your terminal goes. the log viewer is a thin wrapper over the same renderer the tui uses for the journal preview, packaged as a one-shot.
~2,800 lines of rust total. the tui alone is 1,200. scope creep is real but i was having fun.
the gnarly bits
killing the journalctl subprocess
first version of the daemon was the obvious thing: spawn journalctl -f -o json --output-fields=... as a subprocess, parse json line-by-line. it works. it also eats CPU, marshals every entry to json, and means you have a child process to babysit.
ripped it out. now the daemon links against libsystemd and reads the journal directly via sd_journal_* (through the systemd rust crate). the journal is mmaped, you add a match for the coredump MESSAGE_ID (fc2e22bc6ee647b6b90729ab34a250b1), seek to the tail, and block on sd_journal_wait(). when something with that message id arrives, you read the fields straight out of the mmap, no fork, no json, no allocation per entry.
let mut journal = Journal::open(JournalFiles::All, false, false)?;
journal.match_add("MESSAGE_ID", COREDUMP_MESSAGE_ID)?;
journal.seek(JournalSeek::Tail)?;

loop {
    while let Some(record) = journal.next_entry()? {
        let entry = Entry::from_record(&record);
        if notify_enabled.load(Ordering::Relaxed) {
            notify(&entry);
        }
    }
    journal.wait(Some(Duration::from_secs(600)))?;
}
idle daemon is now basically free. the kernel wakes us only when a matching record lands, and matched-record dispatch is one syscall plus a hashmap pull. for something that's supposed to live forever in your user session, that matters more than the absolute numbers do.
async gdb so the tui doesn't lock up
the backtrace tab runs gdb -batch -ex 'set pagination off' -ex 'thread apply all bt full' against the dumped core. on a chunky binary this is seconds. if you do that on the render thread, the whole tui freezes. unacceptable.
so the tui kicks gdb off in a thread, hands you back "(running gdb...)" immediately, and polls a channel each frame. when the result arrives it lands in a per-pid cache so re-tabbing into backtrace is instant.
fn ensure_backtrace(&mut self, dump: &Dump) -> String {
    if let Some(cached) = self.preview_cache.get(&(dump.pid, Tab::Backtrace)) {
        return cached.clone();
    }
    if self.bt_in_flight == Some(dump.pid) {
        return "(running gdb...)".into();
    }
    let (tx, rx) = channel();
    let d = dump.clone();
    thread::spawn(move || {
        let res = coredump::backtrace(&d).map_err(|e| e.to_string());
        let _ = tx.send((d.pid, res));
    });
    self.bt_rx = Some(rx);
    self.bt_in_flight = Some(dump.pid);
    "(running gdb...)".into()
}
bonus: you can switch to a different crash mid-gdb and the previous one quietly finishes in the background. when you come back to it, thread apply all bt full is already in the cache. very vim energy.
±5 minutes of journal around every crash
the logs tab is the one i use most. it grabs every journal entry from crash_time - 5min to crash_time + 5min, colorcodes by priority, and dumps it next to the crash. nine times out of ten the actual cause is sitting three lines above the segfault in some unit you forgot was running.
the bracket comes from __REALTIME_TIMESTAMP on the coredump record, which is microseconds since epoch. you subtract/add 5 minutes worth of microseconds and pass journalctl --since / --until with iso timestamps. the renderer then grep-ish scans for err / fail / warn / fatal / panic in the message and tints accordingly.
statusnotifieritem tray (the dbus dance)
the optional tray is --tray. it's a StatusNotifierItem (the freedesktop spec waybar / plasma / kde / xfce all support) implemented over zbus. the tray:
- left-click → spawns the tui in your
$TERMINAL(or falls back throughxdg-terminal-exec→ kitty → foot → alacritty → wezterm → konsole → gnome-terminal → xterm) - right-click → menu: toggle notifications, quit
- icon flips between two colors when notifications are muted
writing a SNI implementation from scratch is less bad than you'd think. zbus does most of the painful interface-codegen work. what's left is owning the right object paths (/StatusNotifierItem, /MenuBar) and making sure your NewStatus / NewIcon signals fire when state actually changes.
the log browser
the second screen (2 from anywhere) is a log browser. it walks:
/var/log,/run/log~/.local/share,~/.local/state,~/.cache,~/.configfor stray app logs- every
journalctl -F _SYSTEMD_UNITsource (system and user) as a virtual file - the kernel ring buffer (
dmesg) - the full journal (
journalctl) as one giant scrollable virtual file
everything goes through the same level-colorcoder. enter a source for fullscreen, enter again to open in $EDITOR. r to rescan, R to refresh just the previewed file. it's basically lnav but i never bothered to learn lnav and i wanted a thing that didn't need a config file to be useful.
the keybinds rabbithole
i have opinions. the keybinds are vim-flavored, single-letter where possible, and modal. what j/k does depends on whether you're in the list or in the preview.
the part i'm proud of is the y chord:
y then p   →  yank pid
y then e   →  yank exe path
y then g   →  yank `coredumpctl debug <pid>` so you can paste it into another shell
y then i   →  yank the full info dump
auto-detects wl-copy / xclip / xsel. the gdb-cmd yank is the one i use most. half the time i don't actually want gdb inside crashout, i want the command in another tmux pane. now it's two keys.
s cycles sort, m toggles group-by-exe, f cycles signal filter, t cycles "since" filter (all / 1h / 1d / 1w / boot), u shows only crashes from failed systemd units. all of this should have been in coredumpctl in 2014 but here we are.
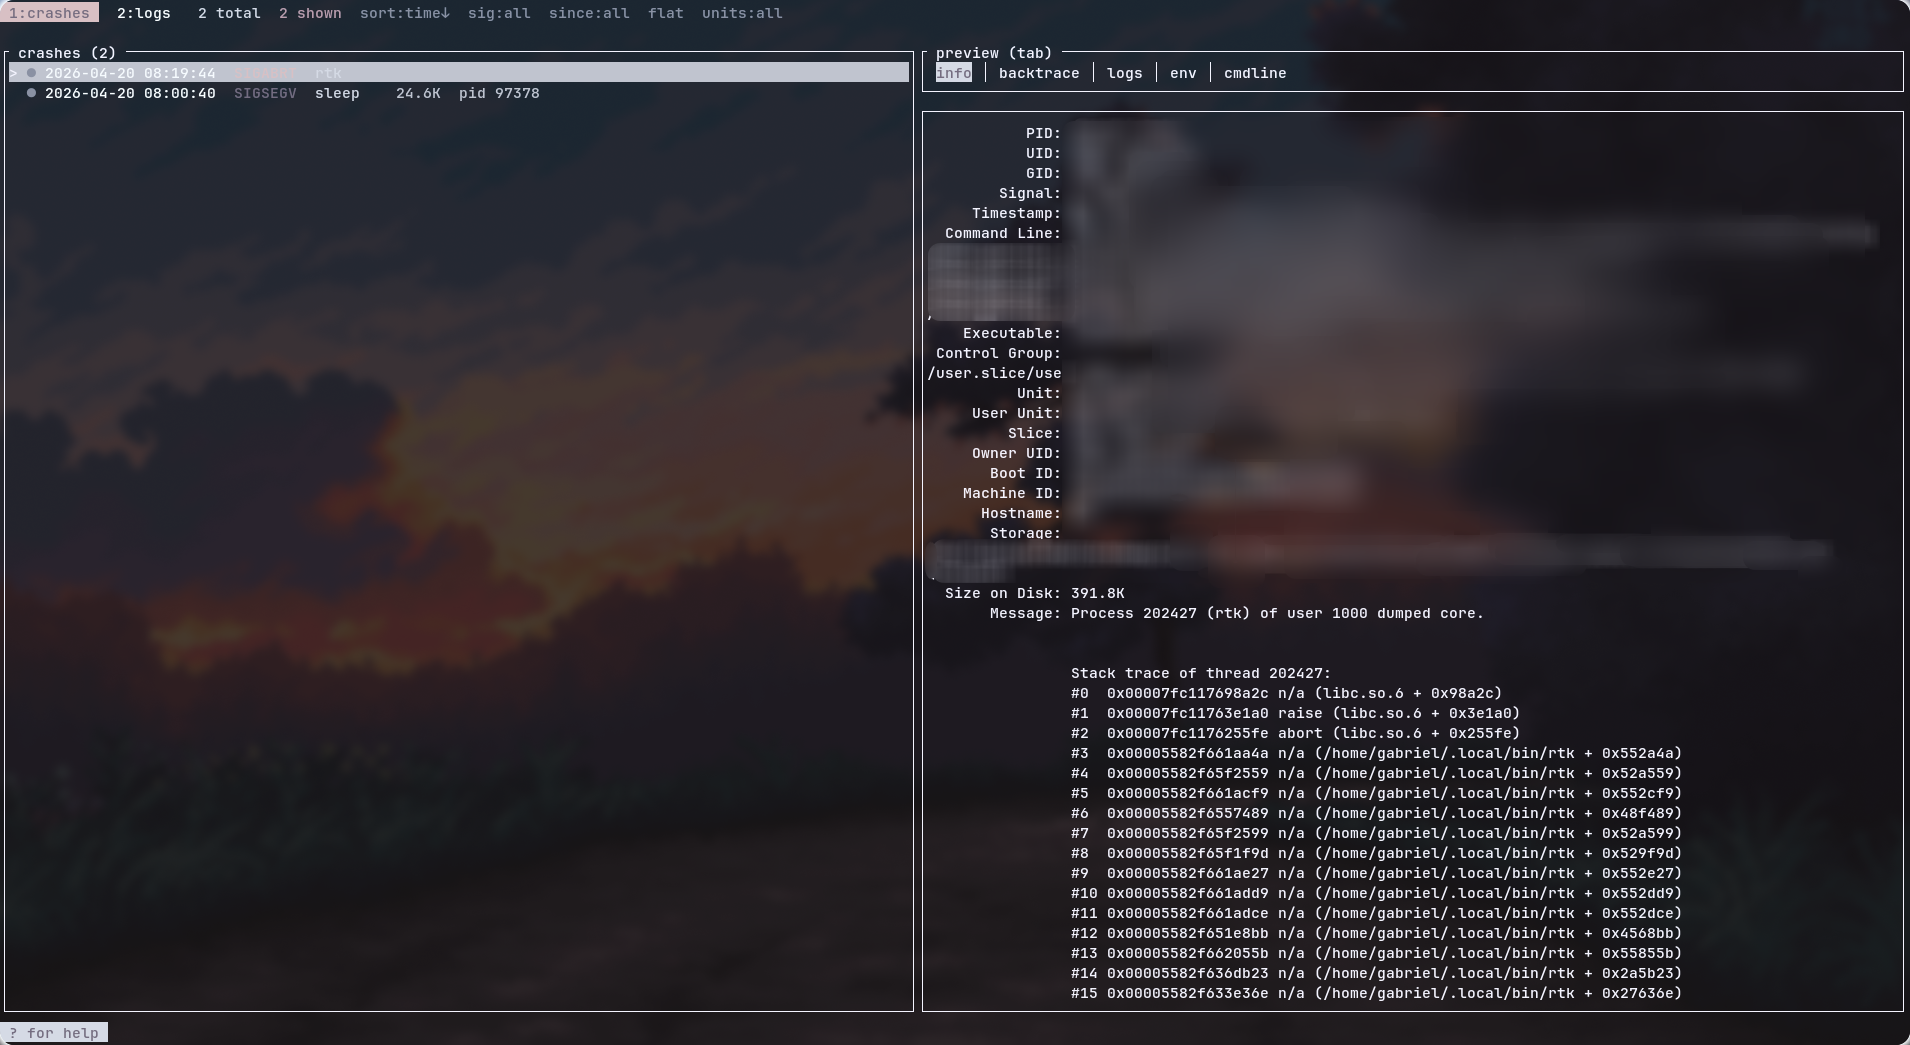
what it looks like
install + use
git clone https://github.com/GabriWar/crashout
cd crashout
cargo install --path .
then either run it interactively:
crashout              # tui
crashout log /var/log/Xorg.0.log   # one-off log viewer
or wire the daemon into systemd-user so it sits and watches forever:
install -Dm644 contrib/systemd/crashout.service \
  ~/.config/systemd/user/crashout.service
systemctl --user enable --now crashout.service
requirements are basically "you're on a systemd distro": systemd-coredump enabled, gdb on path, coredumpctl + journalctl on path, optional wl-clipboard / xclip / xsel for yank, and any StatusNotifierItem host for the tray.
what's next
- per-binary grouping with rolling stats. "this binary segfaulted N times in the last week, here's the most-common signal." catches flaky processes early.
- BPF tracepoint integration. hook
sched_process_exitw/ a non-zero status and capture stdout/stderr-tail without needing a full coredump. for the thingssystemd-coredumpignores (non-elf, no signal, weird containers). - flame-graph render of the backtrace right inside the tui (ratatui canvas). because if i have the bt and i have a terminal, why am i still alt-tabbing to a browser.
mit license. fork it, rip it apart, send prs. and if you're on a non-systemd distro and want crashout to support runit/openrc-y coredump pipelines, open an issue. i don't have one to test on.
— gabriwar